Measuring frustration in Quiddler, a word game
A favorite card game in my family is Quiddler. The goal of the game is to spell one or more words with the cards in your hand, and score the most points with your words. I recently became curious about a question: could I measure the probability of being able to form a valid hand on your first turn?
First, to briefly explain the rules: A game of Quiddler starts with everyone being dealt three cards. The number of cards increases each round. On your turn, you can draw a new card, but you must discard. Your goal is to “go out” by using all of your cards to spell one or more words. Once someone at the table goes out, the rest of the players get one more turn. Then they have to show their hands, whether they’ve formed words with all their cards or not. Any cards that aren’t part of a valid word are counted against your score for the round.
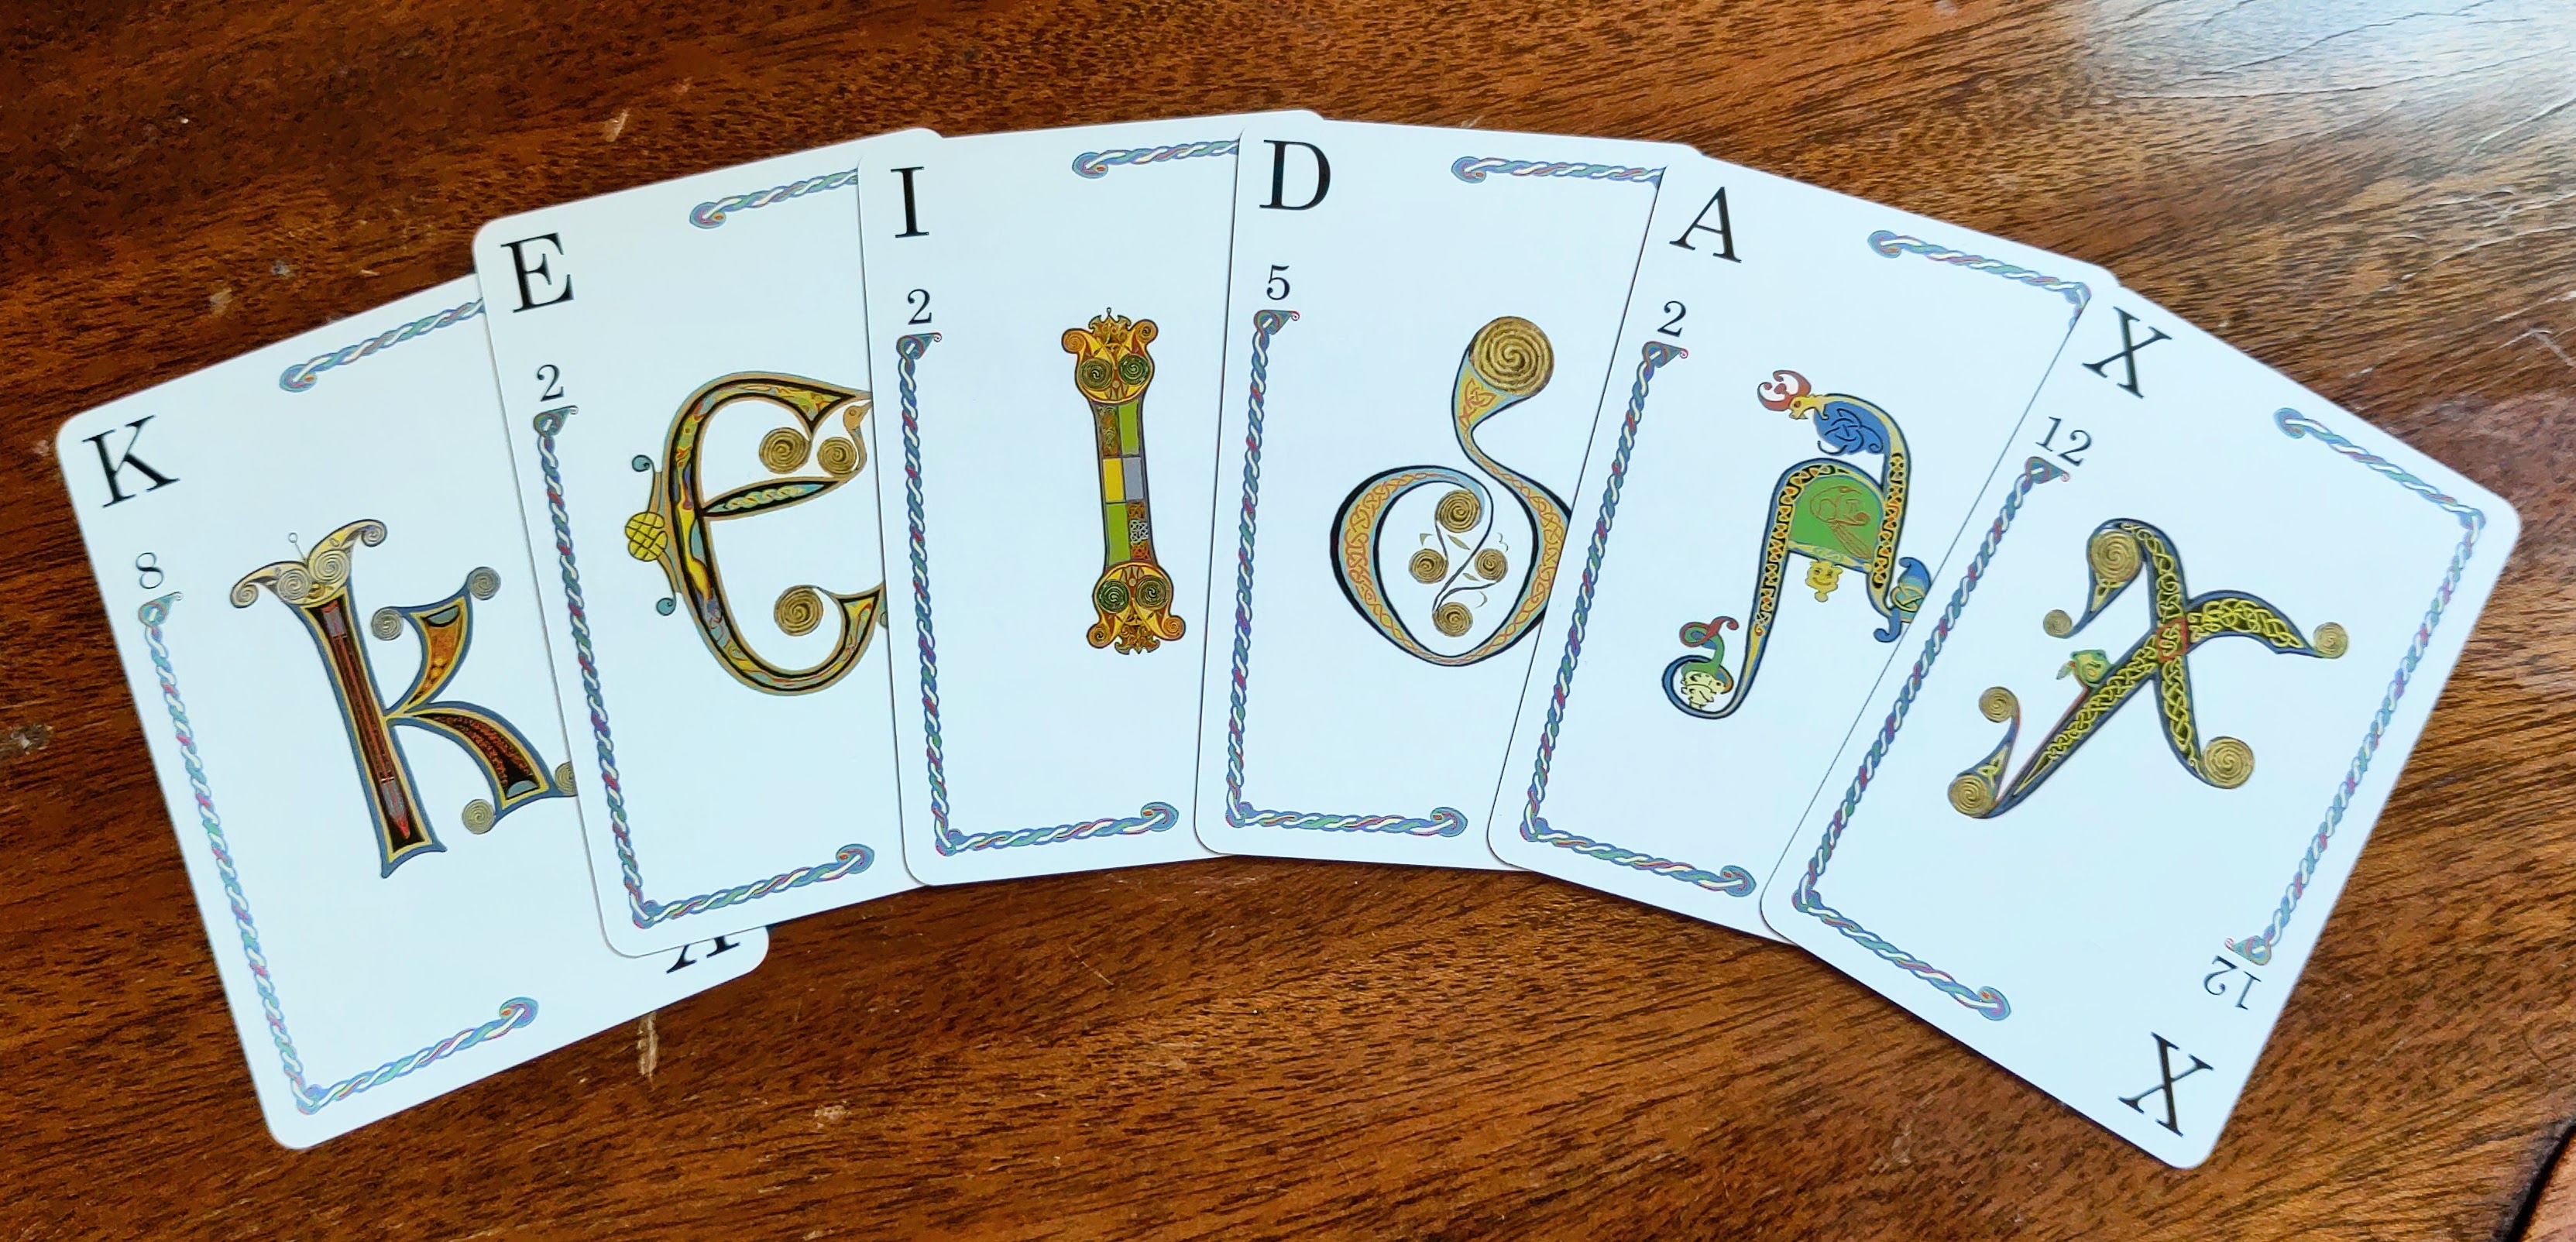
A random sample of Quiddler cards.
We have a long-standing house rule: you can’t go out on your first turn. This means each player gets at least two turns to recover from a bad start, like being dealt all consonants. We came up with this rule after everyone became familiar with the frustration of the first player immediately throwing down a good hand while you’re struggling to make sense of a bunch of Qs and Xs. During a recent game, I wondered if this house rule could be slowing down play. This prompted several questions:
- As the game progresses and the number of cards increases, does it become more or less likely that you can go out right away?
- What is the probability of being able to go out on your first turn?
- How likely is it that the majority of players could all go out on their first turn?
To begin, I had to choose a word list. Quiddler allows the players to choose their own dictionary, and the usual choice when we play is the Official Scrabble Players Dictionary. I couldn’t find an easily downloadable source of words for this dictionary, but I did learn about the NASPA Word List, or NWL, which is used for tournament Scrabble play in the US. It should be close enough for my purposes! A direct download of the NWL requires an active NASPA membership, but the freely-available Zyzzyva word study program includes multiple versions of the NWL in its data files. I’ll use the latest version, NWL2023.
With a word list in hand, I wrote a basic simulation of a Quiddler game. It operates as follows:
- For a round with
Ncards, randomly selectN+2cards from the deck. The firstNcards represent the initially dealt hand, the next card is the top of the discard pile, and the last card is drawn from the top of the deck. - Using the first
N+1cards, check each possible combination ofNcards. If one or more dictionary words can be made exactly withNcards, this counts as a valid hand. The process simulates the player taking the visible card at the top of the discard pile, then discarding to go out. - If the player hasn’t gone out yet, remove the
N+1th card from the set, and add theN+2th card. Repeat the process of checking each combination ofNcards in the set. This simulates the player opting not to take from the discard pile, and drawing a face-down card instead. - Steps 1-3 are a single trial in the experiment. Repeat many more trials, and measure the number of successes and failures.
This is a simplistic simulation. For instance, it doesn’t account for the previous player being more likely to discard a difficult-to-use letter like J, Q, or Z.
The data and code used in this post are available at github.com/keidax/quiddler-odds. Here’s a display of the data:
With some initial results in hand, I began to grow suspicious. This answers my first question: it’s easier to go out when you have more cards. But after 10,000 trials, it appeared that the chance of being able to go out on your first Quiddler hand of 3 cards was a whopping 85%. This didn’t feel right to me — I knew from experience that more than 1 out of 5 hands is unplayable at first. I took another look at the simulation, and realized what was going on: with access to the complete dictionary, my program had an inhumanly perfect vocabulary. This means it uses words like KAE (“a bird resembling a crow”), ZAX (“a tool for cutting roof slates”), and OE (“a whirlwind off the Faeroe islands”). Maybe world-class Scrabble players could pull this off, but not most folks.
It was time to search for a new word list.
After some digging, I came across Google’s Trillion Word Corpus.
This seemed promising: I could create a dictionary based on how frequently words were used, thus more accurately representing the average person’s working vocabulary.
Several processed versions of this dataset are available at norvig.com/ngrams.
I used the count_1w.txt data file, which represents the 1/3 million most frequent words on the Internet (as of 2006).
This data already comes sorted by frequency, and filtering out invalid words (those that don’t appear in NWL2023) is trivial.
Next I had to decide how large the dictionary should be. I started looking into how many words the average person knows, and quickly realized this is not a question with a single obvious answer. It depends on the definition of a “word”, on the definition of “knows”, as well as factors like age and education.
This was quickly becoming more of a research project than I anticipated, so I went for an ad-hoc approach: I skimmed the word list until I reached an arbitrary cutoff point of increasingly unusual words, then rounded to a nice even number. I ended up with a list of 20,000 mostly-common words, which I’m calling the “regular word” dictionary.
Granted, regular_words.txt has some obvious flaws for this project.
The choice of cutoff is haphazard; it doesn’t really reflect anyone’s actual vocabulary.
Since the original N-gram data was scraped from the Internet, it skews heavily towards technological vocabulary.
For example, according to the original dataset, ONLINE is the 80th most frequent word in English.
And the list still includes surprises like OE, which is apparently a few ranks more common than BEVERAGE.
(I suspect this is an artifact of how the data was gathered.)
Using the new list of regular words and rerunning the simulation, we see a measurable decrease in the number of hands that can go out immediately:
To be honest, I don’t really trust these numbers either. The simulation still plays “perfectly” — it will always find one or more dictionary matches if any valid words exist for the current set of cards. That’s just not how humans play games. Part of the fun of Quiddler lies in scouring your brain for just the right set of words. Nobody will perform that search perfectly, all the time.
Still, this gives an baseline on what plays are possible, and I’ll consider this an answer to question #2. It’s time to move on to the last question: what are the odds that most players can go out on their first turn in a round?
First, the estimated probabilities of going out from the “regular words” data:
| Number of cards | Estimated probability |
|---|---|
| 3 | 0.787 |
| 4 | 0.786 |
| 5 | 0.830 |
| 6 | 0.864 |
| 7 | 0.878 |
| 8 | 0.889 |
| 9 | 0.902 |
| 10 | 0.920 |
Next, let’s establish some notation. I’ll use \(p(c)\) to represent the probability of a player going out when dealt \(c\) cards. And I’ll use \(P(g | n, c)\) to mean the probability of \(g\) players going out on the first turn when there are \(n\) players dealt \(c\) cards each.
Let’s consider 3 players and 3 cards. Each player has a 78.7% chance of going out on the first turn, since \(p(3) = 0.787\).
\[P(0 | 3, 3) = (1 - 0.787)^3 \approx 0.010\] \[P(1 | 3, 3) = (1 - 0.787)^2 \times 0.787 \times 3 \approx 0.107\] \[P(2 | 3, 3) = (1 - 0.787) \times 0.787^2 \times 3 \approx 0.396\] \[P(3 | 3, 3) = 0.787^3 \approx 0.487\]Note the \(\times 3\) appearing twice. This represents the number of ways to select a single player in a group of 3 players. We can generalize this formula. If \(n \choose g\) is the number of ways to select \(g\) players out of \(n\) total players, then:
\[P(g | n, c) = (1 - p(c))^{n - g} \cdot p(c)^g \cdot {n \choose g}\]If this formula is unclear, I recommend looking up binomial coefficients.
Next, we can calculate the expected value of the number of players going out. I’ll represent this as \(E[n, c]\):
\[E[3, 3] \approx 0.010 \times 0 + 0.107 \times 1 + 0.396 \times 2 + 0.487 \times 3 = 2.36\]What I’m actually interested in is the number of players who can’t go out on the first turn. Let’s call this the expected frustration:
\[E_{frustration}[n, c] = n - \sum_{g = 0}^{n} P(g | n, c) \cdot g\]So \(E_{frustration}[3, 3] \approx 3 - 2.36 = 0.64\).
Here’s our final result: the expected frustration value for most rounds of Quiddler.
| Number of cards | 3 | 4 | 5 | 6 | 7 | 8 | 9 | 10 |
|---|---|---|---|---|---|---|---|---|
| 3 players | 0.64 | 0.64 | 0.51 | 0.41 | 0.37 | 0.33 | 0.29 | 0.24 |
| 4 players | 0.85 | 0.86 | 0.68 | 0.54 | 0.49 | 0.44 | 0.39 | 0.32 |
| 5 players | 1.06 | 1.07 | 0.85 | 0.68 | 0.61 | 0.55 | 0.49 | 0.40 |
| 6 players | 1.28 | 1.28 | 1.02 | 0.82 | 0.73 | 0.67 | 0.59 | 0.48 |
| 7 players | 1.49 | 1.50 | 1.19 | 0.95 | 0.85 | 0.78 | 0.69 | 0.56 |
| 8 players | 1.70 | 1.71 | 1.36 | 1.09 | 0.98 | 0.89 | 0.78 | 0.64 |
What does this tell us in the end?
I think the “regular words” data and the simulation process represent a better-than-average vocabulary, so I’m cautious about drawing conclusions from the specific numbers. But it’s clear that the frustration value trends down each round. For anyone playing Quiddler with a similar house rule, then I would offer a modification: Only limit when players can go out during the first four rounds of the game. Hopefully this reduces the frustration of an early bad hand while keeping the game moving along.
Happy playing! 🃏